Panagiotis Chatzinikolaou
I am a data professional with experience in data analytics, visualization and statistical analyses, using programming and analytical tools like R, Python, SQL, and Power BI. I am passionate about continuous learning and transforming data into actionable insights.
Experience
- Business Intelligence Analyst, Centre of Reporting Excellence, Circana, 03/2025-present
Education
- PhD in Quantitative Exercise Physiology, Aristotle University of Thessaloniki, 2020-2024
- MSc in Human Performance and Health, Aristotle University of Thessaloniki, 2017-2019
- BSc in Sport Science, National and Kapodistrian University of Athens, 2010-2017
Projects
Data Analytics
World Happiness Report
This interactive report allows users to explore how GDP relates to life satisfaction scores across different countries and regions of the world. I used Power Query to clean, transform, and join the World Happines and World Bank (GPD and population) datasets. Next, I created an interactive Shiny app using ggplot2 and ggiraph, highlighting the top 5 happiest countries in the world (Finland, Denmark, Iceland, Sweden, and Netherlands). The interactive app is available here. All code and data are available on GitHub.

Programming languages and technologies: R, Power Query, Shiny, ggplot2, ggiraph
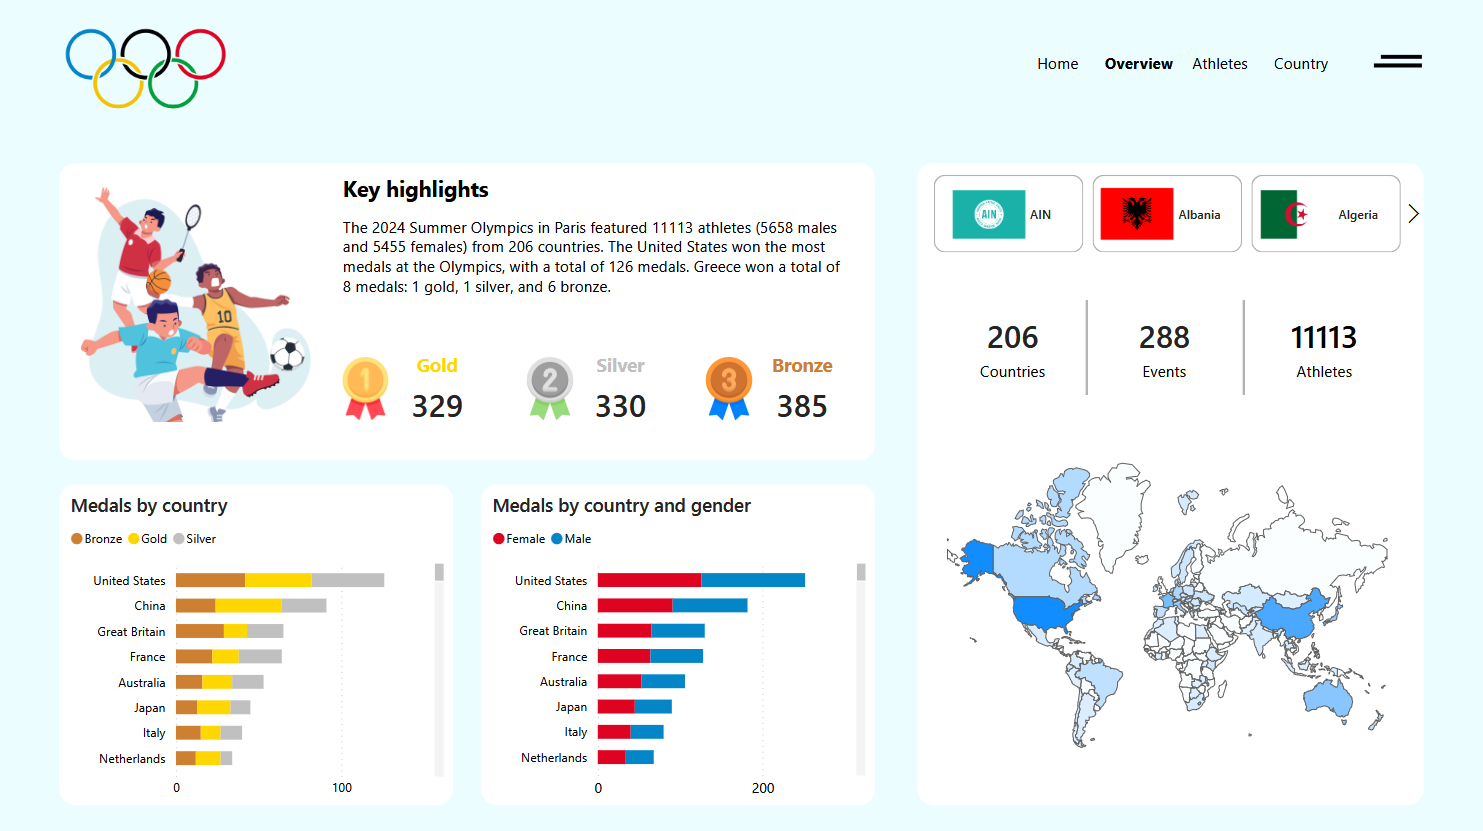
Paris Olympics Dashboard
This project showcases a dynamic Power BI dashboard for the 2024 Paris Olympic Games. A Python script was used to download the dataset, via Kaggle’s API, which was then loaded into Power BI. Data cleaning and transformation were performed within Power BI using Power Query and DAX. The dashboard includes interactive figures highlighting key metrics, such as total medals by country. The complete dashboard is available here.
Programming languages and technologies: Python, Power BI, DAX, Power Query
PhD Data Analysis and Statistics
This project accompanies our scientific paper from my PhD: “Erythrocyte glycolytic and redox metabolism affects muscle oxygenation and exercise performance: a randomized double-blind crossover study in humans”. It features data preparation, visualization, and statistical analysis scripts. The analyses include custom scripts for linear models, repeated measures ANOVA, post-hoc tests, and effect size calculations. All code and datasets are available on the project’s GitHub repository.
Programming languages and technologies: R, tidyverse, afex, lme4, emmeans, multcomp

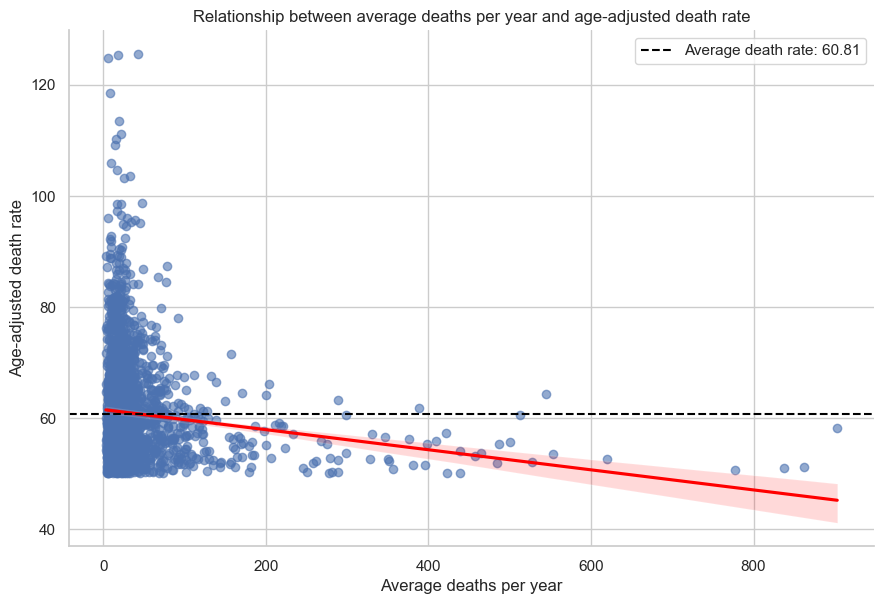
Healthcare and Bioinformatics Data Analysis
This portfolio features projects where I used Python and SQL to conduct exploratory data analysis on datasets from healthcare, bioinformatics, and finance. This work projects involved data cleaning, transformations, calculating statistical summaries, and creating visualizations to present key insights. Key projects include analyzing the impact of nutraceuticals on lifespan (DrugAge), cancer research trends, longevity gene variants, Covid testing patterns, and liquor store sales. The code and datasets can be found on the project’s GitHub repository.
Programming languages and technologies: MySQL, Python, SciPy, pandas, seaborn, plotly
Data Engineering
Strava Analytics Engineering
This end-to-end data engineering project automates the extraction, transformation, and loading (ETL) of Strava activity data into Supabase for analytics and visualization. It fetches activities from the Strava API, transforms and cleans the data using Polars, and stores it in a PostgreSQL database in Supabase. A FastAPI webhook app, deployed in Render, ensures real-time updates whenever new activities are recorded, and the processed data is connected to Looker Studio for reporting. All code and instructions are available on GitHub.
Programming languages and technologies: PostgreSQL, Python, Polars, FastAPI, SQLAlchemy
Paris Olympics Database
This project involves creating a relational database in PostgreSQL using the 2024 Paris Olympics dataset within a Docker container in GitHub Codespaces. Data were downloaded from Kaggle as CSV files and imported into a PostgreSQL database. The database includes tables for athletes, medals, countries, events, and teams, enabling the tracking of athlete participation, medal distribution, and country performance. It supports CRUD operations, reporting on top-performing athletes and countries, and optimized queries using views and joins, providing a comprehensive system for analyzing Olympic data. The full code and datasets can be found here.
Programming languages and technologies: PostgreSQL, codespaces, docker, mermaid.js
Fitness Data ETL Pipeline
This project involved developing an ETL data pipeline to process fitness activity data from Strava and Intervals.icu using Python and SQL. Data was extracted from CSV files, and custom scripts were written to ensure data type quality and perform necessary transformations. Using SQLAlchemy, the data was then loaded into a relational database in SQL Server Management Studio (SSMS). The pipeline automated data ingestion and standardization to streamline storage and analysis. All code can be found here.
Programming languages and technologies: Python, Pandas, SQLAlchemy, pyodbc, T-SQL, SSMS
Web Applications
Mathematical Modeling of Hemoglobin and ShinyApp Simulation
This project focused on developing a mathematical model of the hemoglobin oxygen dissociation curve in R. Then, an interactive Shiny web application was created to simulate and visualize the curve under various physiological conditions, as well as to facilitate effective communication of the model. The R model was published in a peer-reviewed scientific journal (see publication here). The code is available in the GitHub repository, and you can explore the Shiny app here.
Programming languages and technologies: R, Shiny, tidyverse, ggplot2
Weather Web Application
This project involved building a responsive weather web application using the OpenWeather API. The backend was developed in Python with Flask, handling API requests and data processing, while the frontend was styled with CSS and HTML for a user-friendly interface. The application was deployed on Render for seamless access. The code is available in the GitHub repository, and you can try out the app here.
Programming languages and technologies: Python, Flask, requests, waitress, CSS, HTML

Protein Database App
Developed an R Shiny App that queries data from the UniProt biological database for human proteins and provides specific information for each protein. The app takes the protein ID’s as input and provides insights based the protein’s amino acid sequence. The app is available here.
Programming languages and technologies: R, tidyverse, Biostrings, httr2, RShiny
Fun Code
Yen to Euro Rate Automation
In this project, I used GitHub Actions to automate the retrieval of the latest JPY to EUR exchange rate every week, and send an email alert if the exchange rate drops below a threshold. The script queries the JPY to EUR exchange rate from ExchangeRate-API. The code is available on GitHub.
Programming languages and technologies: R, httr, jsonlite, emayili